Have you added fields to your Microsoft Dynamics 365 Sales system that you want to see in a Power BI visualization? If you are using the default Power BI template, you won’t see these fields as options. To add them to your reports, you will need to use Power BI Desktop to customize the queries.
In my previous blog, I shared how you can add custom options to the fields that are already part of the Power BI template, but this time I will show you how to add a completely new field to the data. Doing so will allow you to track all the business-specific data that matters to you with the full set of Power BI features.
Before proceeding with this process, make sure you have downloaded the template to Power BI Desktop as described in this blog.
Add New Fields to the Report
The first step is to ensure that data for your custom fields are being pulled in at all. To do that, follow these steps:
- Click Transform Data (or Edit Queries).
- In the left menu under the Entities folder, select the entity you want to add a field to.
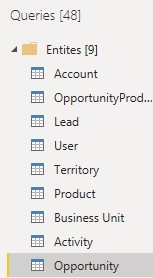
- Once you do, you’ll see a table of the data associated that that entity (I’m using opportunities in my example), as well as a set of Applied Steps already taken to prepare the data for Power BI in the right menu. These steps are preconfigured by your template.
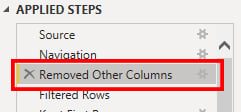
- To add your new field, double click the step in the right menu called Removed Other Columns.
- The dialogue that appears asks you to check the columns you would like to keep. If your data has refreshed recently, you should see the field you are looking for (under its internal field name) in the list. Check it and select OK.
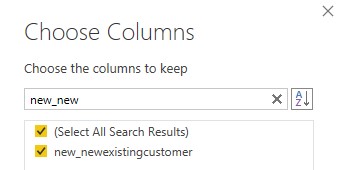
Your field will now be added to the entity’s table; however, it will likely only contain the code values for your field's options and not the text, making it difficult to use in Power BI visualizations.
Create a New Table
To switch out internal codes for the actual names of our fields, we will use the same process that the template already employs for other fields in your report.
- First, we need to create a table that contains the internal codes and their matching values. To keep things neat, click the Make Tables (1) folder icon in the left menu and then select the Enter Data (2) option in the New Query section of the ribbon.
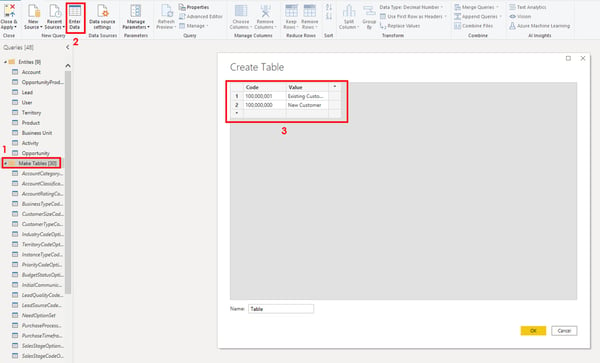
- This will open a table editor. Using your internal values from CRM, create a simple table with the code in one column and the value in the other (3). To add a new row or column, click the * icons at the bottom or right of your table.
- Name your table something that makes sense to you based on the field. Something like “[FIELDNAME]CodeOptionSet” should work.
Bring Values into Your Entity Table
Next, we will associate the entity with the new table to match code values and return the field option names (much like a VLOOKUP function in Excel).
- Go back to your entity using the left menu.
- Click Merge Queries from the Combine section of the ribbon.

- In the top box, you will see a preview of your data columns. First, select the header of the column with your field codes in the entity (1). This should be the same as the internal field name.
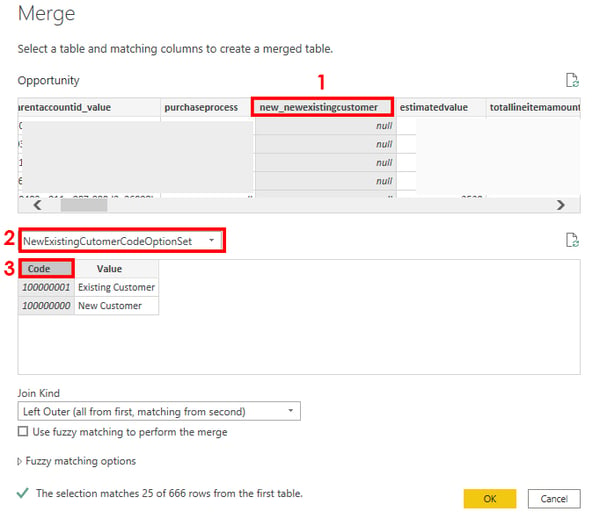
- Then, select the table you just created from the drop-down selector (2).
- Finally, click the column header for the column with your code values in it (3), which should be the left column.
- You will see a preview at the bottom based on the data sample. It tests to see if anything matches. In most cases (unless most of your data has no information for the field), you will see at least a few matches.
- Hit OK.
One final set of steps will make this data accessible for Power BI visualizations.
- While still in your entity, scroll across until you see a column with the name of the table you created. You should see a small icon in the upper corner of that column header’s name. Click it.
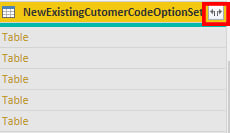
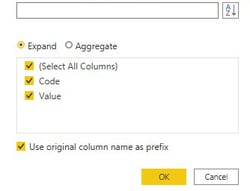
- The dialogue that comes up allows you to expand this column by splitting the two columns from your created table into separate columns on your entity. The default options will work, so select OK.
- Lastly, right-click the column that was created with your values (it should have the format “[TABLENAME].Value” if you are following along). Select Rename to name the column something more specific to what you are measuring, such as “New/Existing Customer” or “Opportunity Type.”
When you close and apply your Transform Data window, your Power BI report will refresh and attempt to render your new data. To test that it worked, once the data is completely refreshed, open the entity with the field you added in the right menu under Fields. You should see the field you added in the list. You can create new visualizations with it or drag it to visualization, page-level, or report-level filters.
Now you can begin building the reports you want with your custom fields. I hope this short tutorial has been helpful to you. With the processes in this blog and the previous entry, you’ll be using Power BI to measure your CRM metrics in no time!


