You've seen the term everywhere, you hear it's important to your business, and your boss keeps asking to see a dashboard of your company metrics. But what actually is Power BI?
Simply put, Power BI is Microsoft's business analytics software that connects with all your data sources, combines them into related tables, and then allows you to build visualizations to understand the data in more creative and insightful ways.
What makes it unique? Each part of its name gives us clues.
"Power"
The "Power" in Power BI's name refers to its place as part of Microsoft's Power Platform. The Power Platform consists of:
- Power BI
- Power Apps (low/no code application builder)
- Power Automate (low code, cross-platform automation)
- Power Virtual Agents (create your own chatbot)
These services overlap and complement one another and are all built to rely upon Microsoft's Dataverse. This Cloud-based, cross-platform data repository also forms the basis of Dynamics products like Business Central SaaS and Dynamics 365 Customer Engagement. This shared data source means the Power Platform products operate with a single source of truth. There's no integration and syncing here; it's just one set of data.
That said, the Power Platform can also interface with an incredible number of different data sources—including on-premise servers, social media services, and third-party tools like Google Analytics and Zendesk. If your application isn't on the list, you can even readily create custom APIs.
Power BI is no exception. It can interpret data from all these sources and then display it through Power Apps, activate a workflow in Power Automate, and so much more.
"BI"
BI is short for business intelligence, which is its own class of software. By combining historical and predictive data from a wide range of sources, business intelligence software aims to help leaders make decisions that fit the data.
Typical uses of business intelligence include:
- Tracking revenue and profit trends
- Showing ROI for various expenditures
- Understanding warehouse, purchasing, and sales performance
- Identifying correlations among a business's KPIs
Business intelligence is all about compiling data and displaying it in ways that lay bare new understandings of the truth. For example, suppose a business was disappointed that its profit margin was under its goal; however, showing its margin over time last year reveals that a big spike is coming due to seasonal changes.
Bringing It Together

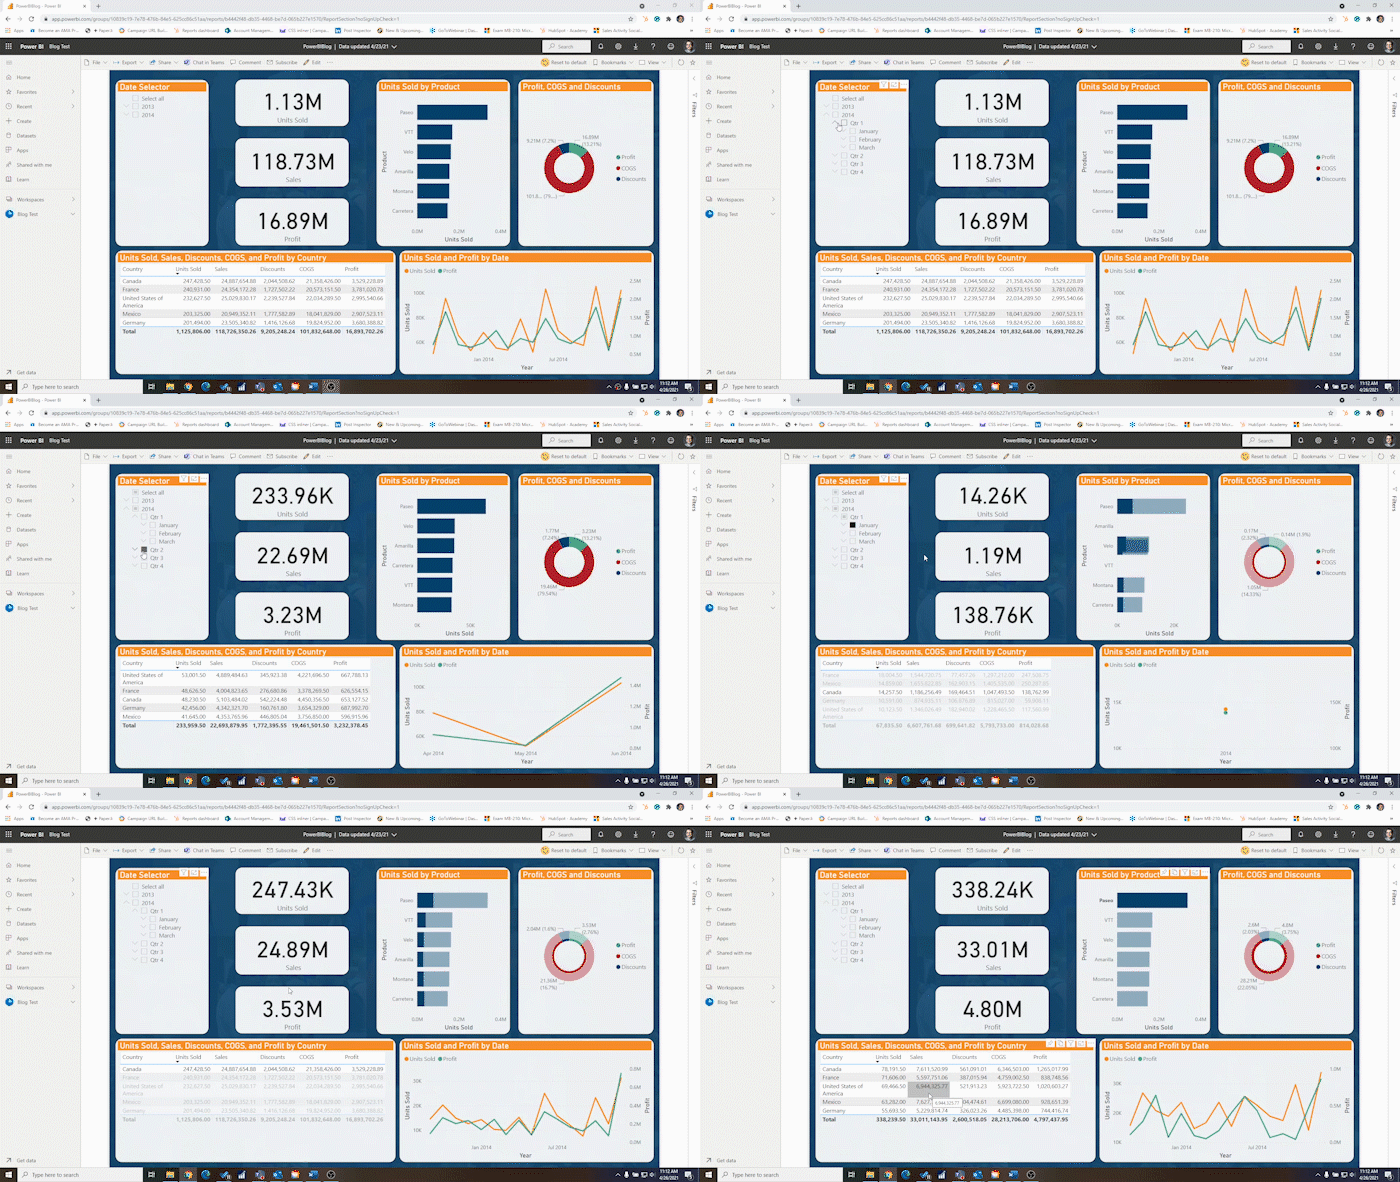
Above is a very simple but functional Power BI report based on a sample dataset from Microsoft. See how clicking the various components adjusts the data displayed.
As you can see, Power BI is a mixture of the innovative and seamless technology Microsoft delivers with the Power Platform and a state-of-the-art business intelligence suite. When these components come together, that's where the magic happens.
But let's take a brief look at more practical definitions of Power BI. What we call Power BI is three separate applications that serve different functions:
- Power BI Desktop – The PC version of Power BI allows you to pull in data and design visualizations with a high level of precision and control. In general, most reports you use will be built in Power BI Desktop because it allows you to access many more features than the other options for pulling in data, specifying relationships, and creating visuals. What you build in Power BI Desktop can be used in all three applications.
- Power BI Service – Accessing your data from the web is the goal of Power BI Service. Housed at https://powerbi.microsoft.com, it allows anyone to share reports/dashboards and have them refreshed on a set schedule (or, in some cases, in real-time). Power BI Service is also where you compile and distribute Power BI apps (a completely different topic). While you can create new reports here, you have fewer options than in the desktop version.
- Power BI Mobile – As you might guess, Power BI mobile is a mobile app that allows you to view your reports on the go. It is primarily intended to be a viewer, so build your reports elsewhere.
While we have already alluded to them, let's take a closer look at the different components of Power BI's actual data:
- Datasets – The foundational piece of Power BI is the dataset. It is quite simply the raw data you've compiled from the sources you're using. It is a set of tables and values that doesn't yet show much meaning to a human viewer.
- Reports – Once you have a dataset, you can build a report. A report is akin to a file in programs like Excel and Word. It is a specific project of visualizations, text, and relationships that interprets the information in a dataset and presents it so that a human being can build meaning.
- Dashboards – Only available once your data has been uploaded to the Power BI Service, Dashboards can be thought of as the next step up in reports in the hierarchy. They display pages from several reports, individual visualizations, or tiles built on other datasets. A dashboard can display essential information in a set of reports and allow the user to click into each one directly for more details.
Next Steps
Now that you've learned all about Power BI and understand what it is and why it's crucial to a business, where do you go from here? Here are several suggestions:
- Visit our Power BI product page to learn more about how you can get Power BI for your business.
- Watch the latest Power BI webinar in our on-demand webinar library.
- Register for the next Introduction to Power BI training workshop to get a comprehensive jumpstart using it.


